Filter detections and download new rules
Our map visualization improved significantly since the first prototype. It now has the functionality to filter by technology, address and time; and shows different technologies with different colours. Beside that, the amplitude of the detections is shown by the radius of the circles and the number of detections at one place is shown by the value inside the circle. On click of one of those markers, a small info box pops up on the map.
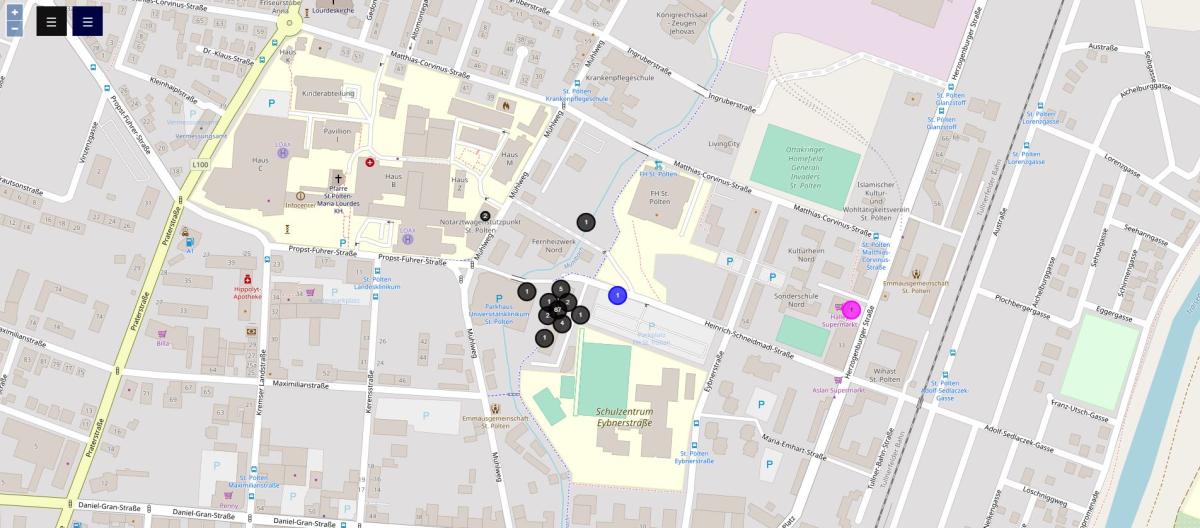
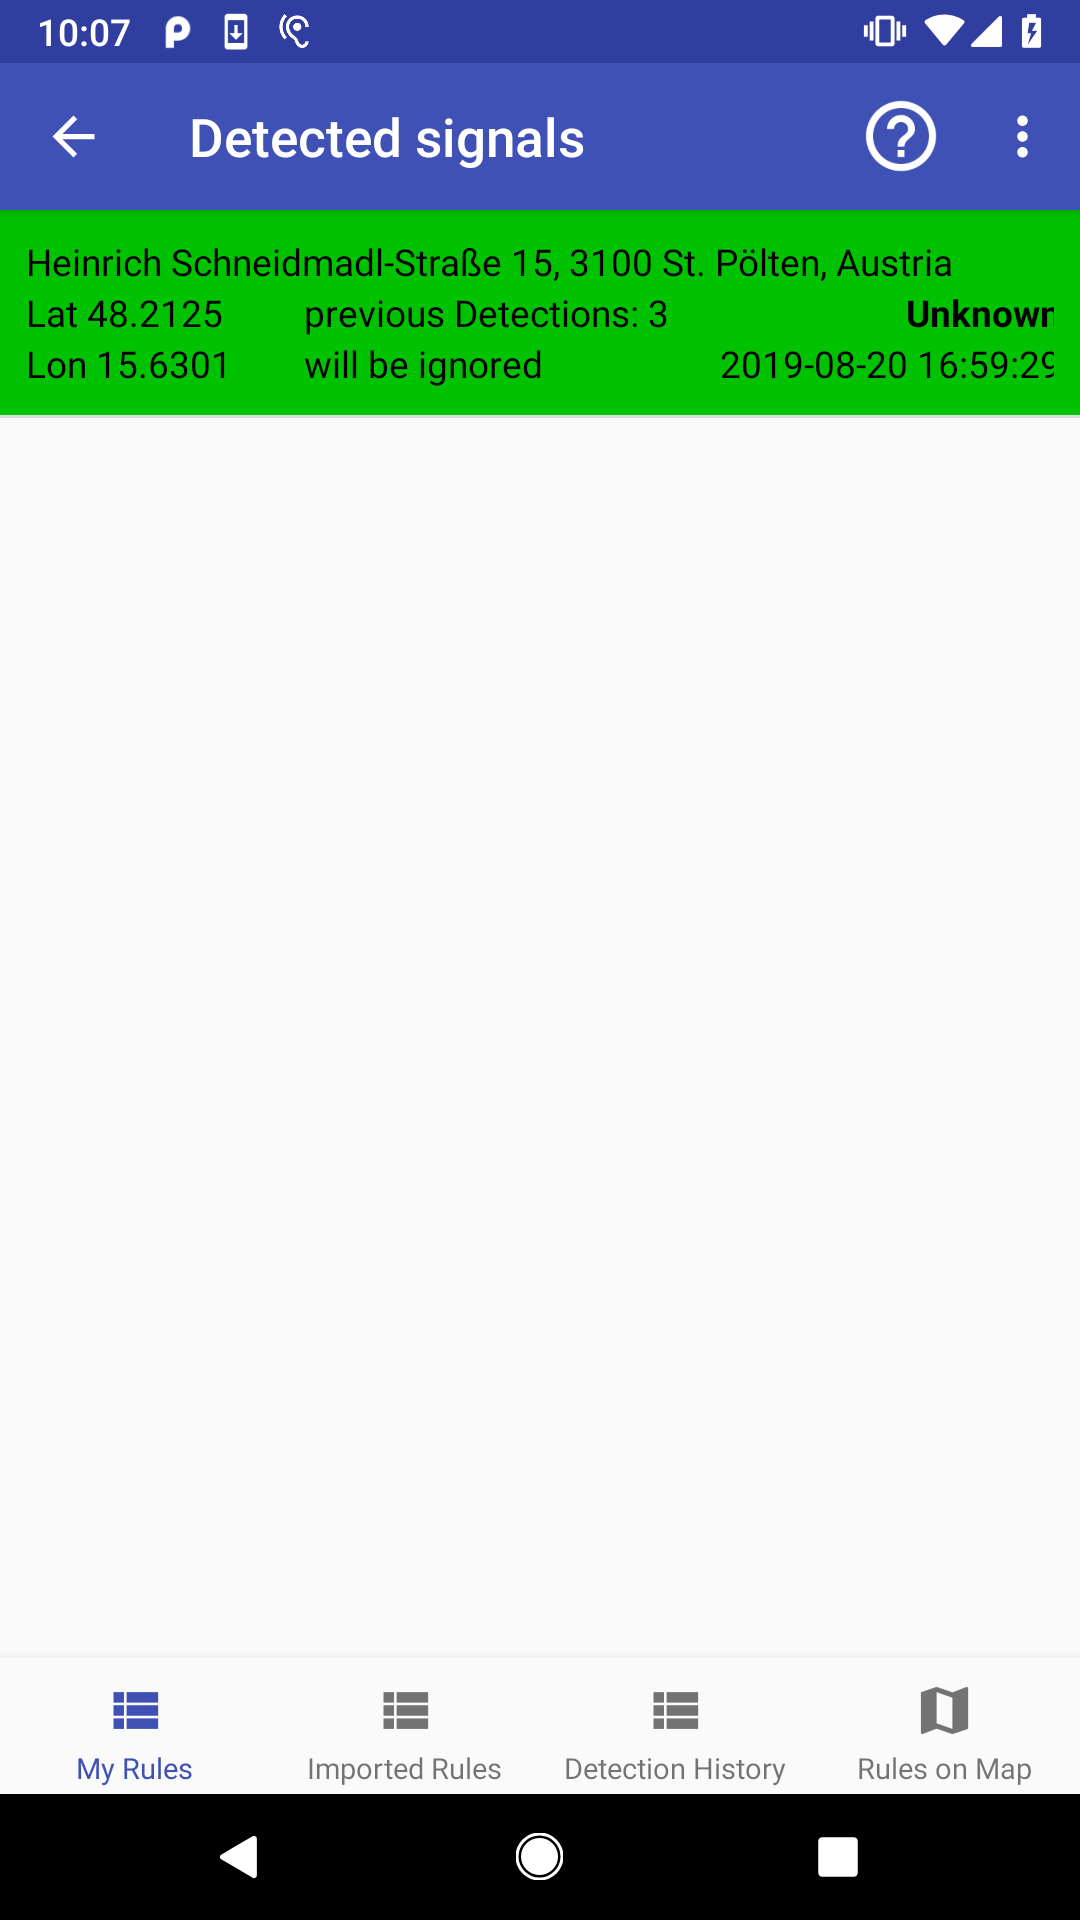
Furthermore, the same visualization is now realised on the mobile application, where only locally saved detections are shown offline. Moreover, the “Detected signals” screen changed. It is now split into four sections. Detections which were chosen for block or ignore always, are now saved as firewall rules, namely “My rules”, whereas all detections, independently from the blocking choice, are shown in “Detection history”. The third tab “Imported rules” contains a new feature: you can now download detections shared by other users from the server and use them as firewall rules. They will act like your own detected rules. The fourth tab embeds the new map visualization.
We also changed the color coding to a clearer: Green/Orange/Red showing how the user perceives each detected signal. A detection is shown green when always ignored by the user, red when always blocked by the user, and orange when the user changed their choice to Ask next time.